A Day Is Not Exactly 24 Hours
Exact Day Length* — Fri, May 8, 2026
Today's prediction: 24 hours, 0 minutes, 0.0002055 seconds (0.2055 milliseconds)
Yesterday: 23 hours, 59 minutes, 59.9999354 seconds (-0.0646 milliseconds)
At the start of today, UT1 was 0.0321565 seconds ahead of UTC.
Look up a day length in the past
* Based on mean solar day. Numbers provided by the International Earth Rotation and Reference System Service (IERS).

The Earth's rotation slows down over time.
©iStockphoto.com/nukleerkedi
Earth's Rotation Defines Length of Day
Modern timekeeping defines a day as the sum of 24 hours—but that is not entirely correct. The Earth's rotation is not constant, so in terms of solar time, most days are a little longer or shorter than that.
The Moon is—very gradually—slowing the Earth's rotation because of friction produced by tides. Over the course of a century, the length of a day increases by a couple of milliseconds (where 1 millisecond equals 0.001 seconds).
Within this general trend, however, there is fluctuation: sometimes the Earth spins a bit faster, sometimes a bit slower. Recently, our planet has been speeding up a little, making for slightly shorter days.
How Long Is Today?
Today is predicted to be 0.2055 ms (milliseconds) or 0.0002055 seconds longer than 24 hours. This is the time it takes Earth to rotate 9.56 cm (3.76 in), as measured at the equator.
This means that today lasts:
- 24.0000000571 hours or
- 24 hours and 0.21 ms
On average, a mean solar day in the last 365 days was -0.01 ms under 24 hours, so today's day length is above average. Over this period, 135 days have been longer than today, while 231 have been shorter than today.
If every day were as long as today, a leap second would have to be added every 4866.18 days.
| Today's Day Length* in Context | ||
|---|---|---|
| Day length | Date | |
| Yesterday | 24 hours -0.06 ms | Thu, May 7, 2026 |
| Today | 24 hours +0.21 ms | Fri, May 8, 2026 |
| Tomorrow | 24 hours +0.41 ms | Sat, May 9, 2026 |
| Shortest 2026 | 24 hours -0.61 ms | Sat, Jan 17, 2026 |
| Longest 2026 | 24 hours +1.27 ms | Thu, Apr 16, 2026 |
| Last Year Average | 24 hours -0.08 ms | Year 2025 |
| * The figures for today and tomorrow are predictions. The shortest and longest day lengths are for the year so far (up to and including today). | ||
Average Day Lengths & Leap Seconds
Overall, the Earth is a good timekeeper: the length of a day is consistently within a few milliseconds of 86,400 seconds, which is equivalent to 24 hours. However, over the course of months and years, these small differences can add up and put our clocks out of sync with the Earth's spin. When this happens, a leap second is used to bring them back into alignment.
Leap seconds can be positive or negative. A positive leap second adds a second to our clocks, while a negative leap second subtracts a second.
The system of leap seconds was introduced in 1972. So far, there have been 27 leap seconds, and they have all been positive. The table below shows the yearly average day lengths since 1973.
Subscribe to our newsletter for leap second alerts
How Is True Day Length Measured?
Astronomers and timekeepers express mean solar time as Universal Time (UT1), a time standard based on the average speed of the Earth's rotation. UT1 is then compared to International Atomic Time (TAI), a super-precise time scale calculated by a network of atomic clocks.
The actual length of a day is expressed as the deviation of UT1 from TAI over 24 hours.
Why Isn't Earth's Rotation Constant?
The speed of the Earth's rotation varies from day to day. One of the main factors are the celestial bodies surrounding us.
For example, the Moon's gravitational pull causes tides and changes the Earth's shape, ultimately resulting in a lower rotational speed. The distance between Earth and Moon changes constantly, which makes for daily variations in the speed our planet rotates around its axis.
How Earth’s rotation affects eclipse paths
Find Day Length for Any Date
How Far Back Does the Data Go?
Super-accurate atomic clocks were first developed in the 1950s and 1960s. So measurements of the Earth's rotation using atomic clocks only go back as far as then.
However, telescopic timings of stellar occultations by the Moon provide information about the Earth's rotation going back to the 17th century. An occultation is when the Moon, as seen from the Earth, passes in front of a star.
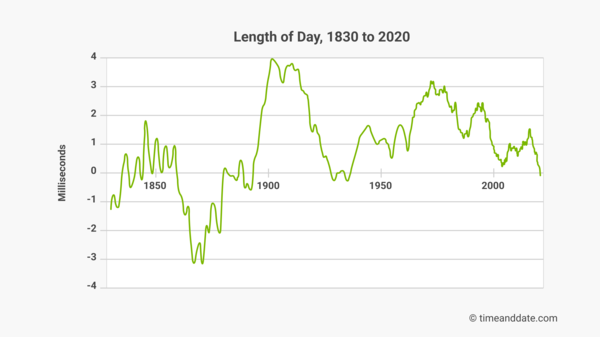

This chart, produced using data from the IERS, shows the length of day going back to 1830. It indicates that Earth was spinning particularly fast around the year 1870, and particularly slow around the start of the 1900s.
©mungfali.galihkartiwa07.workers.dev
Ancient Records Give Away Earth's Speed
Going back even further, records of solar and lunar eclipses provide information from the 8th century BCE onwards.
For example, a Babylonian clay tablet tells us that a total solar eclipse was observable in the ancient city of Babylon on April 15, 136 BCE.
Modern computer models can calculate the path of totality for this eclipse with a high degree of accuracy. From this, we can work out the Earth's spin. For instance, if the Earth had been spinning a bit faster at that time, the path of totality would have passed to the west of Babylon—not directly over the city.